

This case demonstrates our expertise in ingesting, processing, and interpreting highfrequency weather and environmental data, specifically Wet Bulb Globe Temperature (WBGT) heat metrics collected from distributed IoT sensors. It highlights our ability to transform raw sensor data into actionable heat risk indicators and present them through interactive, map-based visualizations that provide real-time situational awareness across large geographic areas. The solution also showcases strong capabilities in
building responsive web applications, integrating geospatial data with live datasets, and delivering insights through multiple communication channels, enabling both operational
decision-making and improved safety outcomes
Problem Statement
One of our clients in the Defence sector has multiple campuses, each equipped with Wet Bulb Globe Temperature (WBGT) IoT sensors installed in high-risk operational areas to monitor heat stress conditions. WBGT readings fall into defined heat risk categories (Levels 1–5), each requiring different operational and safety responses. The client faced challenges in collecting, processing, and interpreting large volumes of sensor data in near real time, as well as communicating actionable heat risk information to personnel in the field. Manual monitoring and fragmented reporting increased operational costs and elevated the risk of heat-related injuries. The client required a centralized solution to ingest sensor data at frequent intervals, process and store the information reliably, visualize heat conditions geographically, and deliver timely alerts and reports, also enabling two-way SMS communication to capture acknowledgements and responses
from subscribed users.
Solution Architecture
The Heat Risk Management solution was designed as a data-driven, cloud-native platform integrating IoT data ingestion, scalable data processing, and multi-channel user communication.
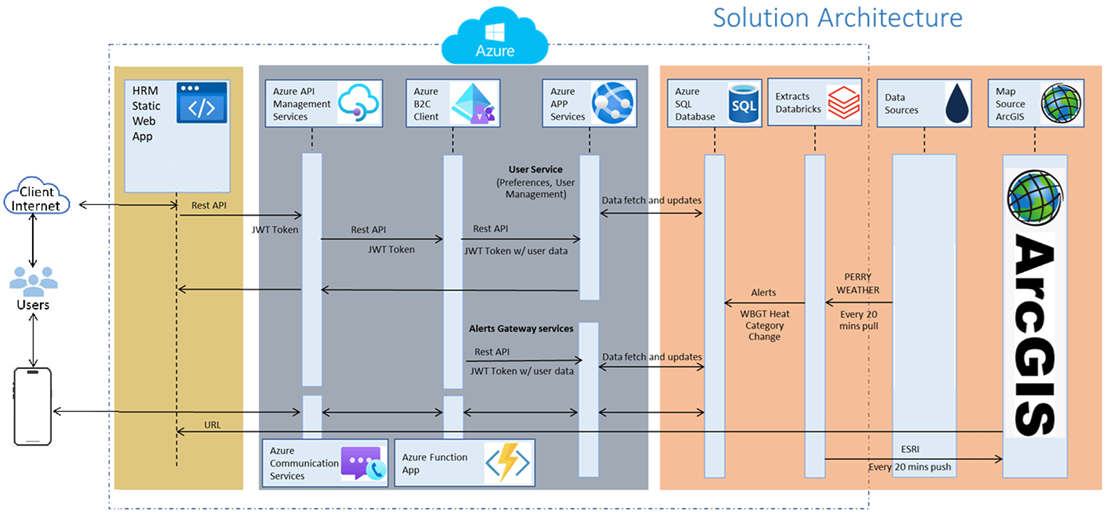
WBGT sensor data from all campuses is collected at five-minute intervals and ingested into a centralized data pipeline. Azure Databricks is used to extract, transform, and process the
incoming sensor metrics, applying business rules to compute WBGT indices and map them to corresponding heat risk categories. Processed data persisted in SQL Server, serving as the system of record for real-time and historical analytics.
Web-based HRM application provides geospatial visualization using ArcGIS of heat metrics on
an interactive map, enabling users to monitor heat risk conditions across campuses and
specific locations. The user interface is delivered using a Node.js-based web application with
server-side rendering, HTML, CSS, and modern JavaScript for responsive and interactive user
experiences
The SMS alerting and reporting capability is implemented using Azure functions and Azure communication services. Azure functions are used to schedule and orchestrate hourly
consolidated heat risk notifications, trigger outbound SMS messages, and process inbound
SMS responses
Key Features and Components
IoT Data Ingestion
Collection of WBGT sensor data from multiple campuses at 20-minute intervals.
Scalable Data Processing
Use of Azure Databricks for data extraction, transformation, validation, and heat risk classification of temperature, humidity, wind speed and solar radiation data types.
Centralized Data Storage
Processed metrics stored in SQL Server for reporting, analytics, and historical
analysis.
Geospatial Visualization
Interactive, map-based visualization of heat metrics and risk categories across
campuses.
Responsive Design
Mobile-first approach with progressive enhancement Touch-friendly interface
elements for mobile devices
- Dashboard: Real-time heat category display with regional breakdown
- Historical Data: Trend analysis with interactive charts
- Regional Views: Location-specific weather information
- Automate data analysis tasks to streamline financial reporting and compliance processes.
SMS functionality
Template-based messaging system using Azure Communication Services for SMS
delivery. It supports two-way SMS communication with response handling
Results at a Glance
- Reduced operational overhead by automating heat risk monitoring and reporting across multiple campuses.
- Improved safety through timely identification of high heat risk conditions and proactive communication.
- Near real-time visibility into environmental heat metrics with geospatial context.
- Reliable and scalable data processing using Databricks for high-frequency IoT data.
- Enhanced situational awareness through two-way SMS communication and response tracking
- Centralized reporting and auditability with historical data stored and accessible for analysis.