Offshore Design & Engineering Equipment (ODEE)
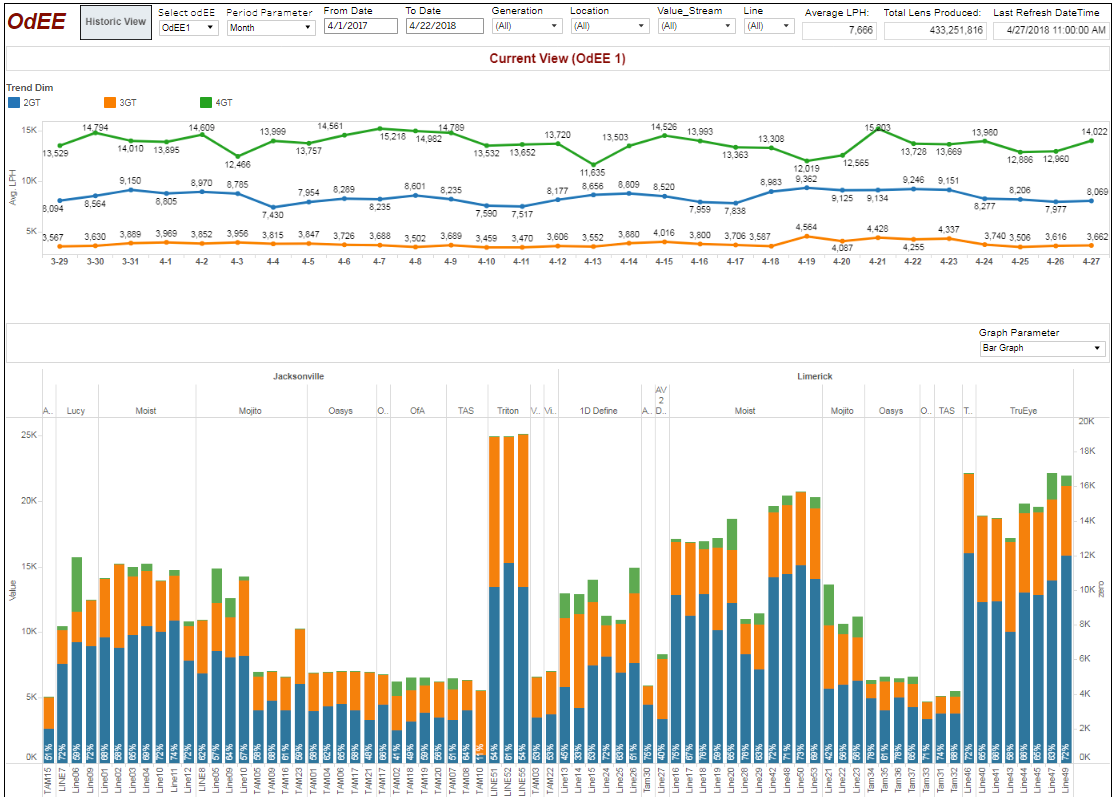
The tableau dashboard provides data visualization and analytics generated from machine
generated data, raising awareness among the staff on the manufacturing line. The report
clearly shows the errors, as well as the impact of those errors on the rest of the production line.
Through visualization, workers can have a bird eyes views at the production line rather than
only being able to concentrate on their own tasks.
Click the Download button to get the CaseStudy
Click the Download button to get the CaseStudy
Fill out the form below to Download the case study
Global Reach and Locations
Where We Operate
Jacksonville, FL (Americas)
Strategic and operational nerve center
London, UK (Europe)
Serving Europe & EMEA customers
Bangalore, Hyderabad (India Centers)
24/7 global delivery and R&D
Fill out the form below to Download the Use Case